The application below demonstrates how “3HLE” helps production plants become Greener & more Ecologic in addition to saving money while producing Higher Quality Coffee Capsules Cups Using Deep Learning Visual Inspection for rejecting only real Delicate Subtle Defects. The defects occurs in 2 situations:
1. when the filters are overlapping Lid (aluminium foil) sealing area.
2. when the filter are slightly mis-aligned, then the coffee powder can leak into the final coffee cup after brewing.
In the past, this application was solved using Complex Traditional Vision Tools and the False Positive Rate (waste: good parts rejected/detected as bad) varies between 2% on the best day and 9% on a bad day. This is without mentioning how many bad capsules arrive into final customer hands. This article do not estimate how much damage bad capsules degrade the image of the Coffee Brands. But for sure, on on bad days, nearly 1 capsule on 10 is susceptible to spit out coffee powder in your cup (just like an automatic coffee brewer). This is not a nice experience for users who are choosing capsule instead of grain coffee.
Now, both of these 2 types of functional defects are easily detected thanks to Simple Deep learning Detection Tools. “3HLE” Automation and Robotics SA warranties a correct detection rate of 99.5%. on bad days and 99.7% on good days. A quick Approximation for a minimum saving/day would be:
False positive: former rejection rate on their best day 2% - actual false positive on the worst “3HLE” day 0.5% = 1.5% improvement (Otherwise, 8.7% improvement in the best case).
Production rate: 20 capsules/sec => 72’000 capsules/hour =>1’728’000/day*1.5% => 25’920 minimum capsules saved per good day for competitors (Otherwise: 150’336 capsules saved per day).
Total saving thanks to “3HLE” Quality Inspection Deep Learning Systems: 25’920 capsules/day in the worst case (Usually, these machines are saving around 150’336 capsules/day).
NOTE: A better detection rate is just a small part of the saving cost because smaller rejection rate will also reduce the logistics for the elimination/recycling trashes and all the infrastructure around the production plants.
“3HLE” is mainly offering Turn-Key solutions including Hardware, Integration of Software and Automation Processes dedicated to high speed automated Computer Vision Quality Control applications. For more Showcases, check out our Sucess Stories pages or check out our Products pages to learn more about our hardware and software solutions. We are working to build up more and more contents in those sections, please subscribe to our “3HLE” LinkedIn, FaceBook or Youtube chanels to get notified as soon as new contents will be available.
Processing time for deep learning inspection per capsule is around 8ms using Windows 10 IoT 3HLE’s Deep Learning Server posted in the company Success Stories section.
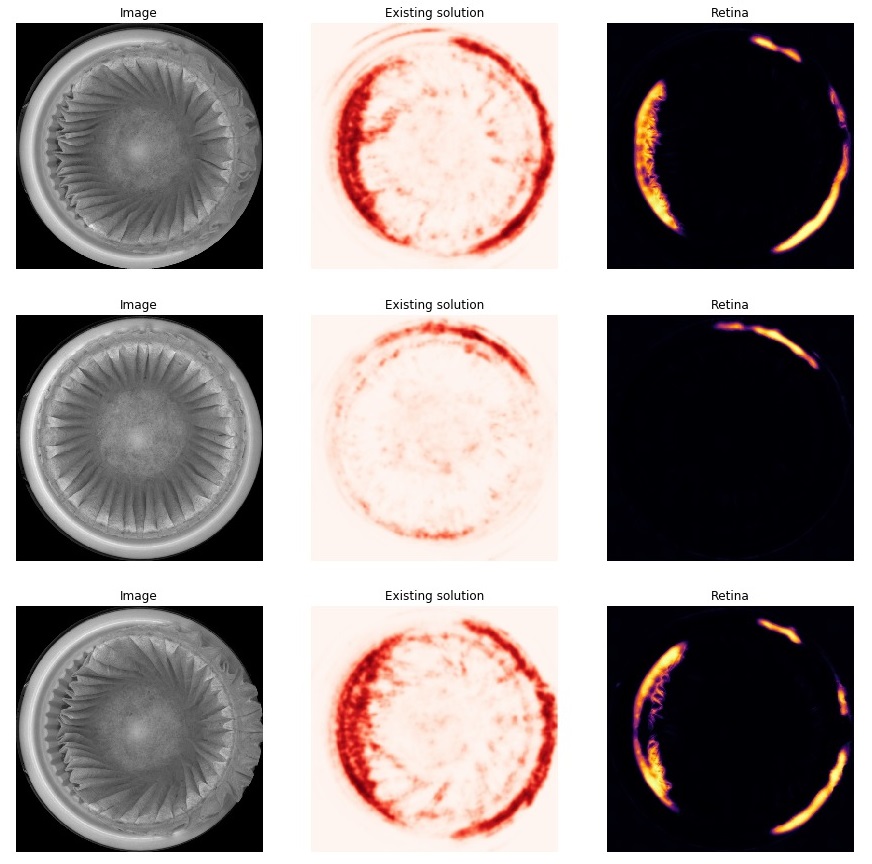
Above is a typical overlapping defects and typical filter mis-alignment defects.
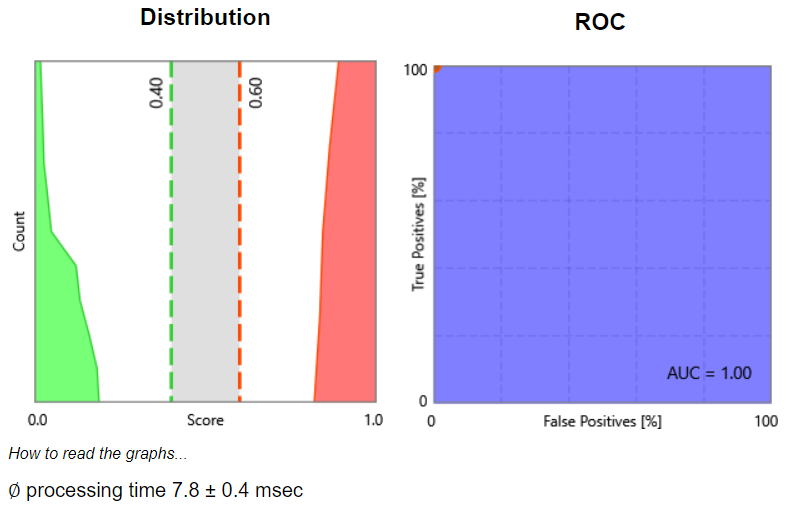
Distribution
Shows the normalized distribution of the deviation for bad and good images. Ideally, theses two curves should not be crossing. The green line represents the threshold below which a piece will be considered as good. The red line represents the threshold above which a piece will be considered as bad. In between those lines is a grey zone, in which the pieces will be considered as intermediate.
ROC (Receiver Operating Characteristic)
Shows the separation of the classes for all possible thresholds. You can take a point on the blue line and read the corresponding True Positive on the left of the graph (a defective View where the system found a defect, ideally 100%). The False Positive rate is on the bottom of the graph (a non-defective View where the system found a defect, ideally 0%). The AUC The AUC (Area Under Curve) value summarizes this curve, whereas the maximum of 1.00 corresponds to a perfect classifier.
Learn More:
Fill in your details below for receiving a link to download the full report and learn more how to Improve your Production Quality and Throughput.
![]()
Please fill in the section below to receive the selected PDF Datasheet by email